


Next: About this document ...
Up: lab_template
Previous: lab_template
Subsections
The use of polar coordinates allows for the analysis of families of curves difficult to handle through rectangular coordinates. If a curve is a rectangular coordinate graph of a function, it cannot have any loops since, for a given  value there can be at most one corresponding
  value. However, using polar coordinates, curves with loops can appear as graphs of functions
When you graph curves in polar coordinates, you are really working with parametric curves. The basic idea is that you want to plot a set of points by giving their coordinates in  pairs. When you use polar coordinates, you are defining the points in terms of polar coordinates
  . When you plot polar curves, you are usually assuming that
  is a function of the angle
  and is the parameter that describes the curve.
In Maple you have to put square brackets around the curve and add the specification coords=polar. Maple assumes that the first coordinate in the parametric plot is the radius
and is the parameter that describes the curve.
In Maple you have to put square brackets around the curve and add the specification coords=polar. Maple assumes that the first coordinate in the parametric plot is the radius  and the second coordinates is the angle
  .
.
This example is a cardiod.
>plot([1-cos(theta),theta,theta=0..2*Pi],coords=polar);
It is not always apparent what domain you need to get the full curve. You can use ParamPlot to animate the plot.
>with(CalcP7):
>ParamPlot([1-cos(theta),theta],theta=0..Pi,coords=polar);
To begin the animation, click on the plot and a new tool bar appears where the buttons resemble vcr controls. Click on the go-arrow. You didn't get the full curve, change the domain until you do.
The relationship between area and integrals in polar coordinates is a little strange; the area inside a circle given (in polar coordinates) by  is NOT just
 . Here is the rule:
Area inside
. Here is the rule:
Area inside
 is given by
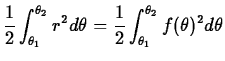 . This comes from the fact that the area in a thin wedge with radius and angle
  is
is
 . Note that this gives you the right answer for a circle:
  . So to find the area of the cardiod use the following command.
>Area1:=1/2*int((1-cos(theta))^2, theta=0..2*Pi);
>evalf(Area1);
Note: Keep your work well organized and clearly labeled.
The equation of a rose is  . For six consecutive integer values of
  do the following four items.
- Plot the rose using ParamPlot and find the domain necessary to trace the entire curve without retracing any part of it.
- For what values will begin and end the trace of one petal. (Use the ParamPlot or use what you know about when cosine equals zero).
- Using plot, plot one petal.
- Find the area of one petal and then find the area of the entire rose by multiplying or by changing the domain.
A final question, how is the value of related to the number of petals of the rose?
Next: About this document ...
Up: lab_template
Previous: lab_template
Jane E Bouchard
2010-01-25