


Next: About this document ...
Up: lab_template
Previous: Background
- Generate a surface plot and contour plot for the following functions on the given domains:
-
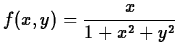 for
for
 and
and
 .
.
-
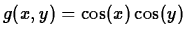 for
for
 and
and
 .
.
- What does the contour plot look like in the regions where
the surface plot has a steep incline? What does it look like
where the surface plot is almost flat?
- What can you say about the surface plot in a region where the
contour plot looks like a series of nested circles?
- Generate a surface plot for the following functions on the domains given.
-
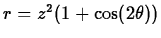 for
for
 and
and
 . Use cylindrical coordinates.
-
 for
and
for
and
 . Use spherical coordinates.
- Consider the following function
 for
for
 and
which looks like a deep valley with a mountain opposite it. Is it possible to find a path from the point
and
which looks like a deep valley with a mountain opposite it. Is it possible to find a path from the point
 to
to
 such that the value of
  is always between
  and
and  ? You do not have to find a formula for your path, but you must present convincing evidence that it exists. For example, you might want to sketch your path in by hand on an appropriate countour plot.
Next: About this document ...
Up: lab_template
Previous: Background
Jane E Bouchard
2005-09-06