


Next: About this document ...
Up: lab_template
Previous: lab_template
Subsections
The purpose of this lab is to find solutions to one equation.
You can set an expression or function equal to another expression, function, or number inside a solve command.As an example, you may want to find where the following two parabolas intersect.
> g := 9*x^2-14;
> h:=-x^2;
> plot([g,h],x=-2..2);
> solve(g=h,x);
The plot shows that there are two intersection points and the solve command finds both  values.It is good to get into the habit of naming your output so you can use it in a later command. Giving the values a name makes it easy to plug them into the function to find the
  values.
> ip:=solve(g=h,x);
Since there are two values called  , use [ ] to call up the one you want.
> subs(x=ip[1],g);
> subs(x=ip[2],h);
Therefore the two intersection points are
 and
and
 . This seems like the answer shown on the graph.
If you would like to find where the following function crosses the horizontal line
. This seems like the answer shown on the graph.
If you would like to find where the following function crosses the horizontal line  you can try the solve command.
> j:=x->2*x^3-15*x^2-2*x+5;
> k:=x->-50;
> plot([j(x),k(x)],x=-3..8);
The graph shows there should be three answers.
> solve(j(x)=k(x),x);
AAAAAAAAAAAAAARG! That is some scary output! So instead of using the algebraic solve try the numerical fsolve.
fsolve(j(x)=k(x),x);
If you want to find where the following function crosses the x-axis, just set it equal to zero.
> f:=theta->-1/2*theta+sin(theta);
> plot(f(theta),theta=-8*Pi..8*Pi);
> solve(f(theta)=0,theta);
Wow, what is that?!?! We know from the graph that there should be three answers and solve wasn't a great option so try fsolve again.
> fsolve(f(theta)=0,theta);
Where are the other two answers!? This is actually how fsolve usually works. It shoots for one answer and only gives that one. But you can tell fsolve where to look by getting an idea from the graph and typing that domain into the fsolve command.
> a:=fsolve(f(theta)=0,theta=-5..-1);
> b:=fsolve(f(theta)=0,theta=-1..1);
> c:=fsolve(f(theta)=0,theta=1..5);
To find the values just plug in the names of the values.
> f(a);
> f(b);
> f(c);
(Of course the y-values are zero!)
Given two planes  and
and
 you can find the line where they intersect with the solve command. First use plot3d to see the intersection
>pl1:=7*x+y;pl2:=1-2*x+y/3;
>plot3d({pl1,pl2},x=-2..2,y=-2..2,axes=normal,style=[patchnogrid,wireframe],
color=["Magenta","Chartreuse"]);
>li:=solve({pl1=z,pl2=z});
Notice that the solution can be written in parametric form:
![$[t,\frac{-27t}{2}+\frac{3}{2},\frac{-13t}{2}+\frac{3}{2}]$](img9.png) or it may be written symmetrtically as:
or it may be written symmetrtically as:
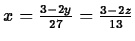 .Note that you can do the algebra for the symmetric form with Maple:
> solve(li[2],x);solve(li[3],x);
- Given the expression
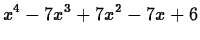 ,
,
- A)
- Plot the expression and in text state how many times the it crosses the x-axis.(Experiment with domain values until you find values that show the crossing points clearly.)
- B)
- Use the Maple solve command to find the values of where it crosses the x-axis (also called the roots).
- C)
- Use the Maple fsolve command to find the roots.
- D)
- State, in text, the value of the roots. Also, how are the results of solve and fsolve different in this problem?
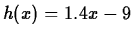
- Given the functions
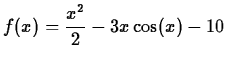 and
and
- A)
- Plot the functions. Again experiment with domain values until the intersection points are clear. Then state in text how many intersection points you see.
- B)
- Using the solve command find the intersection points.Label the values by giving the solve command a name. How many values does the solve command find?
- C)
- Use the fsolve command to find the rest of the answers. Label the values by giving each fsolve command a name.
- D)
- Find all the values and state the intersection points in text.(When writing your text sentence use only two decimal places for the numbers. Round correctly!)
- Find the intersection point of the three planes
 ,
,  , and
, and  . First plot the planes over the domain
 and
and
 .
.
Next: About this document ...
Up: lab_template
Previous: lab_template
Jane E Bouchard
2013-09-11