


Next: About this document ...
Up: lab_template
Previous: lab_template
Subsections
The purpose of this lab is to introduce you to some of the Maple
commands that can be used to plot surfaces in three dimensions.
To assist you, there is a worksheet associated with this lab that
contains examples and even solutions to some of the exercises. You can
copy that worksheet to your home directory with the following command,
which must be run in a terminal window, not in Maple.
cp ~bfarr/Surf_start.mws ~
You can copy the worksheet now, but you should read through the lab
before you load it into Maple. Once you have read to the exercises,
start up Maple, load
the worksheet Surf_start.mws, and go through it
carefully. Then you can start working on the exercises.
The graph of a function of a single real variable is a set of
points  in the plane. Typically, the graph of such a function
is a curve. For functions of two variables in Cartesian
coordinates, the graph is a set of points
in the plane. Typically, the graph of such a function
is a curve. For functions of two variables in Cartesian
coordinates, the graph is a set of points  in
three-dimensional space. For this reason, visualizing
functions of two variables is usually more difficult. For students,
it is usually even more difficult if the surface is described in
terms of polar or spherical coordinates.
in
three-dimensional space. For this reason, visualizing
functions of two variables is usually more difficult. For students,
it is usually even more difficult if the surface is described in
terms of polar or spherical coordinates.
One of the most valuable services provided by computer software such
as Maple is that it allows us to produce intricate graphs with a minimum
of effort on our part. This becomes especially apparent when it comes
to functions of two variables, because there are many more computations
required to produce one graph, yet Maple performs all these computations
with only a little guidance from the user.
The simplest way of describing a surface in Cartesian coordinates is
as the graph of a function  over a domain, e.g. a set of
points in the
over a domain, e.g. a set of
points in the  plane. The domain can have any shape, but a
rectangular one is the easiest to deal with.
plane. The domain can have any shape, but a
rectangular one is the easiest to deal with.
Another common, but more difficult way of describing a surface is as
the graph of an equation  , where
  is a constant. In
this case, we say the surface is defined implicitly.
is a constant. In
this case, we say the surface is defined implicitly.
- Plot the graphs of the following functions over the given
domains. Use the plot3d command.
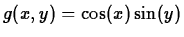
-
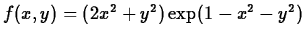 , for
, for
 and
and
 .
.
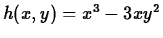
-
 , for
, for
 and
and
 .
.
-
 over the interior of the ellipse
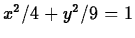 .
.
- Use the implicitplot3d command to plot the graphs of
the following equations. You should come up with plot ranges that show
the surfaces clearly.
- The cylinder
 .
.
-
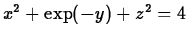 . Can you explain why the surface only
exists for
. Can you explain why the surface only
exists for
 ?
?
- Consider the equation
In the book, it says that such an equation can be reduced by rotation
and translation to one of the two forms
or
Use the implicitplot3d command to graph the surface corresponding to
the equation given above. You should be able to identify the graph as
one of the
types of graphs, i.e. paraboloid, hyperboloid, or ellipsoid, shown in
the text. Can you use your graph to determine which of the two forms
shown above the equation can be transformed into? Do not try
to do the transformation - you don't need to to answer the question.
Next: About this document ...
Up: lab_template
Previous: lab_template
William W. Farr
2001-11-12