The Maple commands for computing partial derivatives are D and diff. The diff command can be used on both expressions and functions whereas the D command can be used only on functions. The examples below show all first order and second order partials in Maple.
> f := (x,y) -> x^2*y^2-x*y;
> diff(f(x,y),x);
> diff(f(x,y),y,y);
> D[1](f)(x,y);
> D[1,2](f)(x,y);
Note in the above D command that the 1 in the square brackets means x and the 2 means y. The next example shows how to evaluate the mixed partial derivative of the function given above at the point
> subs({x=-1,y=1},diff(f(x,y),x,y));
> D[1,2](f)(-1,1);
> g := x-> sin(x)-x^3/7+x^2;
> tl := D(g)(5)*(x-5)+g(5);
> plot({g(x),tl},x=-2..8);
The next example shows how to find the tangent plane to the function
 at
at ![]() . You could write the partials with diff or D. This example uses D as it is easier to plug in the the point with this syntax; with diff the subs command would be used.
. You could write the partials with diff or D. This example uses D as it is easier to plug in the the point with this syntax; with diff the subs command would be used.
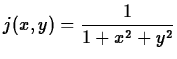
> f:=(x,y)->1/(1+x^2+y^2);
> tp:=D[1](f)(1/8,1/4)*(x-1/8)+D[2](f)(1/8,1/4)*(y-1/4)+f(1/8,1/4);
> plot3d([f(x,y),tp],x=-1..1,y=-1..1,style=patchnogrid);
To find a point where the tangent plane is horizontal, you would need to solve where both first order partials are equal to zero simultaneously.
> solve({diff(f(x,y),x)=0,diff(f(x,y),y)=0},{x,y});
There are two plot commands for three-dimensional graphs plot3d and implicitplot3d. The first assumes the =z and is therefore not included in the command.
>plot3d(g(x,y),x=-10..10,y=-10..10,axes=boxed);Note the difference in the syntax for the second plot command. An equal sign must be included in the equation. This gives the flexibility of being able to graph equations without having to solve for z first.
>with(plots):
>implicitplot3d([x^2+y^2=1-z^2,x=y],x=-1.1..1.1,y=-1.1..1.1,z=-1.1..1.1,axes=normal,color=[black,magenta],style=[wireframe,patchnogrid],thickness=2);
Three-dimensional plots have many options. Some have been used inthe above command. To see more information try these two commands.
>?plot,colornames
>?plot3d,options
 at the point
 and find the equation of the plane tangent to the graph at
 . Plot both tangent planes on the same graph as the surface over the intervals