


Next: About this document ...
Up: lab_template
Previous: Background
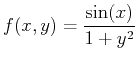
- Use the command plot3d to generate a surface plot and the command contourplot to generate a contour plot with 50 contours for the following funtion on the given domain:
- a)
- What does the contour plot look like in regions where the surface plot has relative extrema?
- b)
- Rotate the 3-d graph and give an estimate of the extrema. (Extrema are the
 values of the highest and lowest points on the graph.)
- c)
- Click your mouse on the point on the contourplot where you think the extrema occur to get an approximate
 coordinate location. Evaluate the function at each of these points and compare to your estimate in part c.
- For the given equations below, plot 2 two dimensional level curves parallel to the
 plane and then plot 2 two dimensional cross sections in the
  plane and again, 2 two dimensional cross sections in the
  plane. Identify the type or shape of the quadric surface, ie. a sphere, cylinder, cone, elliptic cone, paraboloid, elliptic parabaloid, ellipsoid, hyperboloid of one sheet, hyperboloid of two sheets, elliptic hyperboloid of one or two sheets, or a hyperbolic parabaloid (saddle). Once you have determined the shape of the surface, supply a three dimensional plot to support your conclusion.
- a)

- b)
- c)
- Create a contour plot for the function
 for the values
  using two different methods; first using cross sections and then using Maple's contourplot command.
- Consider the following function
 for
for
 and
and
 which looks like a deep valley with a mountain opposite it. Is is possible to find a path from the point
  to
to  such that the value of is always between
  and
and  ? You do not have to find a formula for your path, but you must present convincing evidence that it exists. For example, you might want to sketch your path in by hand on an appropriate countour plot.
Next: About this document ...
Up: lab_template
Previous: Background
Dina J. Solitro-Rassias
2011-03-22