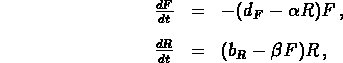
This project concerns the predator-prey model

Here F is the population of the predator (foxes),
R is the population of the prey (rabbits),
and  ,
,  ,
,  and
and  are various proportionality constants.
 and
and  ?
What is the solution
?
What is the solution  ,
,  for this initial data?
This solution is sometimes called an equilibrium solution.
for this initial data?
This solution is sometimes called an equilibrium solution.
 ,
,  ,
,  ,
,  ,
,  and
and  .
For example, should
.
For example, should  and
and  be positive, negative or zero,
and how does the time scale you choose affect your coefficients?
Note the significance of your answer in part (b).
You may want to do some research to help determine the coefficient values.
Characterize as clearly as you can the characteristic behavior of solutions
to this system of equations.
If you are using Maple,
DEplot2 is the recommended plotting command
that you should investigate.
It will generate a direction-field plot for the solution,
as well as plot solutions for various initial data.
Be sure to label your plot(s),
and give units for time and coefficients.
be positive, negative or zero,
and how does the time scale you choose affect your coefficients?
Note the significance of your answer in part (b).
You may want to do some research to help determine the coefficient values.
Characterize as clearly as you can the characteristic behavior of solutions
to this system of equations.
If you are using Maple,
DEplot2 is the recommended plotting command
that you should investigate.
It will generate a direction-field plot for the solution,
as well as plot solutions for various initial data.
Be sure to label your plot(s),
and give units for time and coefficients.
You will be graded on how well you write (spelling and grammar), as well what you say (math content). Do not simply answer the ``for example'' questions above, but rather explore the issues in a short essay that shows understanding of the material. On the other hand, don't be long-winded; in general, short, accurate answers are best. Also don't submit many solution plots with little or no explanation; one, two or three well-chosen and carefully discussed plots will be clear. Do not attach copies of Maple worksheets.
 First Draft Due: Thursday, 9 November 1995
 Final Draft Due: Wednesday, 15 November 1995