Project #3 Fishing in George's Bank
Introduction: This model is concerned with the New England fishing industry, especially George's Bank, which has fallen on desperate times of late. The model covers most of the 20th century as there is a multitude of data available. It is based upon the age specific Leslie model.
Here, we assume we are looking at the haddock population of the north Atlantic, particularly George's Bank. This is a critical area, for in the early and mid 20th century, New England fishing produced consistently over 80% of the United States fish. Also,in recent times, the diet of Americans has slowly moved away from red meat, for health reasons, and has included more fish.
Background matrix algebra (chapter 1 of Kolman or Leon) and the basic Leslie population model (pp. 305-6 Kolman)
In this model, we assume that haddock live to 10 years of age, and may have offspring as early as 3 years old. The Leslie model for this situation, with a time period of 1 year, is of the form
(1) x(k+1) = L x(k) x(0) given k=0,1,2,3...
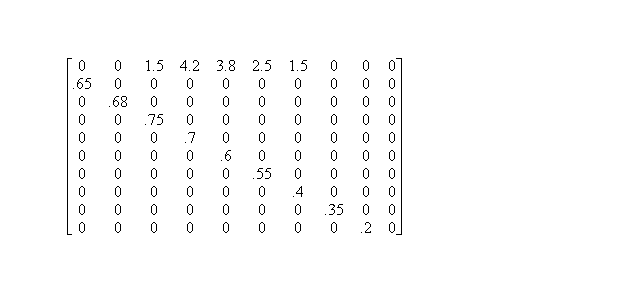
where L is a 10 x 10 matrix which is initially assumed to have values

Equation (1) may be solved iteratively to give
(2) x(k) = Lk x(0) k=1,2,3,...
PART ONE: If the haddock population in 1900 is (55,0,0,0,0,0,0,0,0,0)t (units are millions of pounds), what will the population be like in 1910? 1920? 1930? 1950? 1995?2000? Based upon what you have seen, do you believe the population to be stable or unstable?
If you believe it to be unstable, pick two consecutive populations where the ratios of all components (cohorts) are approximately constant. What is that constant? What does it tell you about the long term behavior of the system?
PART TWO:
Suppose pollution has the effect of lowering each birth rate by 10% of the value given above and each survival coefficient by 15% beginning in 1950. What effect does this have on the population in 1990 as compared to having no pollution effects?
PART THREE: Harvesting.
Beginning in 1925, assume that fish 3 years old and older are caught at a rate such that each year, 35% of those groups are taken. Fish under 3 years old may not be taken (the distinction is based upon size).
a. What is the matrix form of the model now? ( modification of equation (1), above)
Did you assume the fish were harvested before or after the annual birth process occured?
Please generalize to show a model reflecting any harvesting rate which you may denote by h. Thus above, h = .20.
b. What does the population now look like for 1930, 1950, 1995, 2000? Is this a good strategy?
c. Can you come up with an alternate strategy (i.e. a different value for h) which will result in a stable long term population? (you will want to experiment here; if you can set up your worksheet with h as a single parameter which can then be quickly changed, all other equations can remain the same and the effect of changes quickly seen)
PART FOUR: In an attempt to become more efficient, in the 1940s, finer nets were introduced in hopes of catching more fish with the same effort. However in doing so, many millions of young fish (1-3 years old) were caught, killed and disposed of overboard. What does the mathematical model say about the wisdom of such a move?
To explore this, revise your model from Part Three a to include the same harvesting rate for fish in the 1-2 and 2-3 age groups (instead of 0 as before)
Population dynamics aside for the moment, authorities argued that finer nets cost more, were more work to maintain, and took more horsepower to drag. Despite this, they were often used over a 30 year period.
To make the comparison valid, generate populations for the same years as Part Three.
PART FIVE: Fisheries consultants have suggested using two nets, each of area half that of the nets normally used, but of different mesh fineness. This would mean that one net would have mesh fine enough to catch all fish from age 3 to 5 while the second net would be coarser and only catch fish from age 5 and up.
a. how would the matrix model be revised to include this change?
b. could such a scheme be used to generate a better overall harvesting strategy? (meaning a better yield and a stable long term population?)
References:
The New England Fishing Industry by Donald White. The Harvard University Press 1954
An Introduction to Population Ecology by G. Evelyn Hutchinson. The Yale University Press 1979.
Mathematical Ecology by E.C.Pielou. John Wiley and Sons 1978.