Example
A study was conducted to assess the effects of feedback in a repetitive industrial task. The task was to grind a metal piece to a specified size and shape. Eighteen male workers were divided randomly into three groups. All subjects were given the same introduction to the task. After beginning the experimental period, the subjects in one group received no feedback about the task, those in the second group were given vague and intermittent feedback, and subjects in the third group were given accurate and continuous feedback. The response consisted of a measure of the value, in dollars, added to production by each subject during the experimental period. This measure was a function of the number of pieces produced, the accuracy of the grinding operation and the amount of reworking necessary in the remaining stages of production. One worker became ill during the study, and his data were dropped. The data, found in SASDATA.FEEDBACK, are:
| Type of Feedback | ||
| None | Vague | Accurate |
| 40.85 | 38.32 | 48.59 |
| 35.21 | 40.26 | 40.71 |
| 38.17 | 47.47 | 45.33 |
| 43.96 | 44.10 | 43.76 |
| 34.88 | 40.09 | 46.41 |
| 42.67 | 44.19 |
![]()
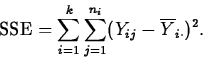
For the present data, i=3, n1=5, and n2=n3=6; ![]() is the
population
mean for the no feedback group, and
is the
population
mean for the no feedback group, and ![]() and
and ![]() are the population
means for the vague and accurate feedback groups, respectively.
are the population
means for the vague and accurate feedback groups, respectively.
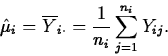
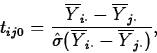
The least squares estimator of ![]() is just the mean of the
observations from population i:
is just the mean of the
observations from population i:
Let's check out the fit of the model to the feedback data.
The residuals
![]()
Here's how to check the fit of the model to the feedback data.
The question researchers most often ask concerning the means model is "Are the population means all equal?"
Formally, the hypotheses are
![]()
These hypotheses are tested using the F statistic. To see what the F statistic is all about, we first need to learn about partitioning the variation in the response into different components, in what is known as the Analysis of Variance (aka ANOVA).
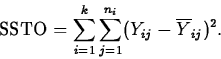
The total variation in the responses is measured by the total sum of squares, SSTO:
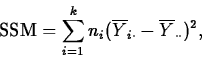
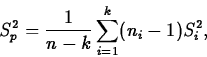
The mean square is the SS divided by its df. Thus MSM=SSM/(k-1), and MSE=SSE/(n-k).
The test statistic for testing equality of population means is the F statistic F=MSM/MSE. It is compared with its distribution under H0, which is an Fk-1,n-k distribution. Large values of F support Ha over H0.
The information about SS, df, MS and the F test is summarized in an ANOVA table. Let's have a look...
![]()
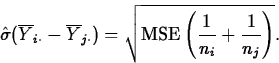
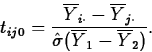
Two multiple comparison procedures which control the overall error rate for all comparisons made are the Bonferroni and Tukey procedures.
![]()
![]()
The one-way effects model is the one-way means model parametrized to emphasize the deviations of population means from an overall mean. It is written
![]()
Example
Four types of highway surface are being tested for durability. Engineers obtained 10 different sites on existing highways to test these surfaces. Since the sites are on different types of highways, the engineers decided to divide each site into four equal sections and randomly assign one surface to each section in such a way that all four surface types appear at each site. In reality, the test sites were monitored periodically and a number of measures of wear were taken on each occasion. The response we will consider is an index of severity of wear, coded on a scale of 0 (no wear) to 100 (severe wear). The data are found in SASDATA.ASPHALT.
Let's look at the data.
One useful model for data of this type is the randomized complete block model:
![]()
Notice that this is an effects model with two factors: blocks,
represented by the ![]() effects and treatments, represented by the
effects and treatments, represented by the
![]() effects. Notice also the model is additive: the
effects add.
effects. Notice also the model is additive: the
effects add.
The least squares estimators of the parameters are:
![]()
The fitted values are
The residuals are, as usual, the observed minus the fitted values,
![]()
The fit is checked by
Let's check out the fit for the asphalt data ourselves.
We test
![]()
As for the one-way model, the ANOVA table shows sums of squares, degrees of freedom and mean squares for the RCB model.
| Analysis of Variance | |||||
| Source | DF | SS | MS | F Stat | Prob > F |
| Pop | k-1 | SSP | MSP | p-value |
|
| Blocks | b-1 | SSB | MSB | p-value |
|
| Error | (k-1)(b-1) | SSE | MSE | ||
| C Total | kb-1 | SSTO |
Let's look at the analysis for the asphalt data.
| H0: | = | ||
| Ha: |
![]()
As for the one-way model, we may use either the Bonferroni or the Tukey procedure to compare more than one pair of means.
![]()
![]()
Consider the ANOVA table for the asphalt data considered as a RCBD:
| Analysis of Variance | |||||
| Source | DF | SS | MS | F Stat | Prob > F |
| Type | 3 | 4407.8 | 1469.27 | 98.88 | 0.0001 |
| Site | 9 | 1026.6 | 114.07 | 7.68 | 0.0001 |
| Error | 27 | 401.2 | 14.86 | ||
| C Total | 39 | 5835.6 |
| Analysis of Variance | |||||
| Source | DF | SS | MS | F Stat | Prob > F |
| Type | 3 | 4407.8 | 1469.27 | 37.0 | 0.0001 |
| Error | 27 | 1427.8 | 39.66 | ||
| C Total | 39 | 5835.6 |
Now consider what this does for estimation. Here is a level 0.95 confidence interval for the difference in mean wear between asphalt types 2 and 3 computed from the one-way model:
(4.915,20.085)
And here is a level 0.95 confidence interval for the difference in mean wear between asphalt types 2 and 3 computed from the RCB model:(8.963,16.037).