


Next: About this document ...
Up: lab_template
Previous: lab_template
Subsections
Often times it is easier to work with an approximating function rather than one that is too complicated to solve analytically or where it is too cumbersome to calculate efficiently thus increasing time in extensive computer loops. One method of approximation is to use a tangent line.
The line equation is
 .
.
 is a point on the function with
 the slope or derivative at that point.
Working with commands from the first three labs the linear approximation can be calculated and plotted for the function
the slope or derivative at that point.
Working with commands from the first three labs the linear approximation can be calculated and plotted for the function
 at the point
 .
.
>f:=x-sqrt(1+x);
>LA0:=D(f)(0)*(x-0)+f(0);
>plot([f(x),LA0],x=-1..5);
Note: you may also use the subs and diff command to calculate the slope.
At the point chosen for the tangent line there is obviously no error between the original function and the approximation. The further from that point increases the error. To calculate the error you simply subtract.
To find how far off the linear approximation is at  calculate the y-value of each and subtract.
>subs(x=0.5,LA0)-f(0.5);
- Graph the function
 on the domain and range
 and
and
 . Then calculate the two linear approximations at
  and
and  . Graph both of these and the function all on one graph. Finally calculate the error of each linear approximation at the point
  . Which gives the better approximation and what is the error.
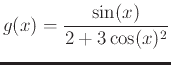
- Looking at the three answers, is there any that you would not recommend using as an approximation to the function and why?
Next: About this document ...
Up: lab_template
Previous: lab_template
Dina J. Solitro-Rassias
2019-12-03