Next: About this document ... Up: Labs and Projects for Previous: Labs and Projects for
![]()
![]()
![]()
Next: About this document ...
Up: Labs and Projects for
Previous: Labs and Projects for
The purpose of this lab is to use Maple to study planar domains and the solids of revolution. Solids of revolution are created by rotating curves in the x-y plane about an axis, generating a three dimensional object. They are discussed in Chapter 6 of Calculus by Varberg and Pursell (sections 2 and 3). The specific properties of them that we wish to study are their volume, surface area, and graph.
If we have a curve lying entirely on or above the x-axis, which is the
graph of a function y = f(x), and x is restricted to being between a
and b, then we may rotate it about the x-axis, generating a three
dimensional object, a solid of revolution.
For example, if the curve is simply f(x) = ax/h (a straight line)
and x is between and h, we obtain a cone of height h and radius a.
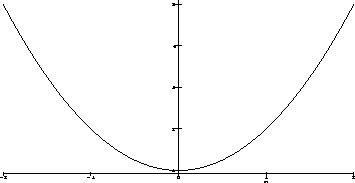
Consider f(x) = x2 + 1 for ![]() which appears in Figure 1.
which appears in Figure 1.
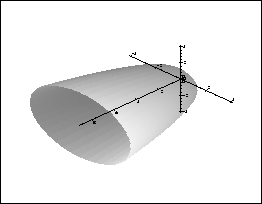
If we take the region between the graph of f(x) and the x-axis and
revolve it about the x-axis then it becomes the surface of the solid
pictured in Figure 2.
If f(x) = x1/2 and x is between, say, and 1, we obtain a bowl
shaped object called a paraboloid. (Note the equation y = x1/2 is equivalent to x = y2, a parabola).
If f(x) = (a2 - x2)1/2 and x is between -a and a,
we obtain a sphere of radius a (since the equation y = (a2 -
x2)1/2 is equivalent to x2 + y2 = a2, a circle of radius
a).
The area of the region R below the graph of
the function ![]() , and above the
x-axis is given by
, and above the
x-axis is given by
![]()
(see p. 263). The region R is bounded by the curve involving the
curvilinear part ![]() the horizontal base
[a,b] with length b - a, and two vertical segments with lengths
f(a) and f(b). The length P
of the curvilinear part of the boundary is given by
the horizontal base
[a,b] with length b - a, and two vertical segments with lengths
f(a) and f(b). The length P
of the curvilinear part of the boundary is given by
![]()
(see p. 321).
The volume of
the solid obtained by rotating the curve ![]() about the x-axis is given by
about the x-axis is given by
![]()
(see Example 4a on page 316 of the textbook for illustration)
The volume is obtained by adding up volumes of cylindrical disks,
while its surface area (p. 324) is given by
![]()
Note that both of these formulas are for rotating the graph of f(x)
about the x-axis.
We will consider planar domains ![]() defined as a union of the
region R introduced above and the region
defined as a union of the
region R introduced above and the region ![]() produced by
reflection of R in the x-axis. Clearly, the area of
produced by
reflection of R in the x-axis. Clearly, the area of ![]() equals 2A, and the perimeter of
equals 2A, and the perimeter of ![]() equals 2[P + f(a) +
f(b)]. Particularly, if the region R is defined as the interior
of a half of the ellipse
equals 2[P + f(a) +
f(b)]. Particularly, if the region R is defined as the interior
of a half of the ellipse
![]()
belonging to the upper half plane y > 0 then ![]() becomes the
interior of a half of the reflected ellipse
becomes the
interior of a half of the reflected ellipse
![]()
belonging to the lower half plane y < 0. So, ![]() - a complete ellipse, and its area is equal to 2A, whereas
its perimeter equals 2P since f(a) = f(b) = 0 in this case.
- a complete ellipse, and its area is equal to 2A, whereas
its perimeter equals 2P since f(a) = f(b) = 0 in this case.
The area radius ![]() of the planar domain
of the planar domain ![]() is defined as
the radius of the circle possessing the same area as
is defined as
the radius of the circle possessing the same area as ![]() , i.e.
, i.e.
![]()
The perimeter radius ![]() of the planar domain is defined
as the radius of the circle having the same perimeter as
of the planar domain is defined
as the radius of the circle having the same perimeter as ![]() , i.e.
, i.e.
![]()
The volume radius ![]() of the body is defined as the
radius of the sphere possessing the volume V, i.e.
of the body is defined as the
radius of the sphere possessing the volume V, i.e.
![]()
The surface radius ![]() of the body is defined as the radius of the sphere having the surface area S, i.e.
of the body is defined as the radius of the sphere having the surface area S, i.e.
![]()
To plot the graph of the function y = f(x) given by the list of
points ![]() we use the command plot
in the relevant format, e.g.
we use the command plot
in the relevant format, e.g.
> plot([[5,5],[6,7],[7,10],[8,12]]);Check it!
To do graphics in three dimensions, we utilize the tubeplot
function from the plots library of Maple, along with suitable
options.
For sake of demonstration, suppose we wish to plot the surface of
revolution one gets from rotating the curve ![]() about the x-axis. Maple commands to accomplish this would be:
about the x-axis. Maple commands to accomplish this would be:
> f:= x -> sqrt(x) + 1;
  > with(plots):
PltStyle:= axes= NORMAL, style= PATCHNOGRID, tubepoints=40;
> tubeplot([x,0,0], x=0..9, radius=f(x),PltStyle);
The last command uses the function tubeplot from the plots library, rotating about the x-axis (as controlled by the first argument, [x,0,0], letting x range from to 9, using the function f(x) to determine the radius at each point, and setting the options as set up by the line assigned PltStyle). The only especially noteworthy thing set by PltStyle is the last option, tubepoints. This effectively determines the resolution of the graph; the higher the value, the smoother it is (but the longer it takes). A value as low as 10 gives a fairly crude surface, by comparison. (Try it!)
Since this involves straightforward integration, one may simply issue commands such as:
> f:= x-> sqrt(x) +1;
> vol:= Int(Pi*f(x)^2, x=0..9);
> evalf(vol);
Assuming the function has been defined, one might issue:
> S:= Int(2*Pi*f(x)*sqrt(1+D(f)(x)^2), x= 0..9);
> evalf(S);
For the function,
![]()
the graph in the (x,y) plane is a half of ellipse;
revolving this graph about the x-axis, we generate an ellipsoid of
revolution.
![$\left[\displaystyle\frac{1}{3},
3\right]$](img36.gif) ..
..Jane E Bouchard