


Next: About this document ...
Up: lab_template
Previous: lab_template
Subsections
The use of parametric equations and polar coordinates allows for the analysis of families of curves difficult to handle through rectangular coordinates. If a curve is a rectangular coordinate graph of a function, it cannot have any loops since, for a given  value there can be at most one corresponding
  value. However, using polar coordinates, curves with loops can appear as graphs of functions.
To assist you, there is a worksheet associated with this lab that
contains examples similar to some of the exercises.On your Maple screen go to File - Open then type the following in the white rectangle:
\\storage\academics\math\calclab\MA1023\Parametric_polar_start_A14.mw
You can copy the worksheet now, but you should read through the lab
before you load it into Maple. Once you have read through the exercises, start up Maple, load the worksheet, and go through it carefully. Then you can start working on the exercises.
>r:=t->[3*sin(t),3*cos(t)];
You can evaluate this function at any value of t in the usual way.
>r(0);
This is how to access a single component.
>r(t)[1];
>r(t)[2];
The graph of a parametric curve may not have a slope at every point on
the curve. When the slope exists, it is given by the formula:
In Maple, the slope of a parametric curve can be calculated using the  command as in the example below.
> r := -> [3*sin(t),3*cos(t)];
> slope := diff(r(t)[2],t)/diff(r(t)[1],t);
The vector equation for the line passing through the point
 parallel to the vector
![$\mathbf{v}=[v_1,v_2]$](img6.png) is given by:
is given by:
Below is an example in Maple using this parametric form of a line that is tangent to the curve  defined above at
 . The plot of the curve and the line on the same graph verifies that the line is tangent at the given point.
>eval(slope,t=Pi/4);
Since the slope at
 is -1, we want the line through the point
 , parallel to the vector
 ![$[1,-1]$](img12.png) .
.
>line:=t->r(Pi/4)+[t,-t];
>with(plots):
>a:=VPlot(r(t),t=-Pi..Pi):
>b:=VPlot(line(t),t=-Pi..Pi):
>display(a,b);
When you graph curves in polar coordinates, you are really working with parametric curves. The basic idea is that you want to plot a set of points by giving their coordinates in  pairs. When you use polar coordinates, you are defining the points in terms of polar coordinates
  . When you plot polar curves, you are usually assuming that
  is a function of the angle
  and is the parameter that describes the curve.
In Maple you have to put square brackets around the curve and add the specification coords=polar. Maple assumes that the first coordinate in the parametric plot is the radius
and is the parameter that describes the curve.
In Maple you have to put square brackets around the curve and add the specification coords=polar. Maple assumes that the first coordinate in the parametric plot is the radius  and the second coordinates is the angle
  .
.
These are three types of well-known graphs in polar coordinates. The
table below will allow you to identify the graphs in the exercises.
| Name |
Equation |
| cardioid |
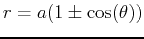 or or
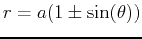 |
| limaçon |
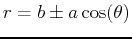 or or
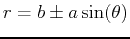 |
| rose |
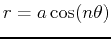 or or
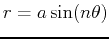 |
Below is an example of a cardiod.
>plot(1-cos(theta),theta=0..2*Pi,coords=polar);
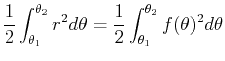
The relationship between area and integrals in polar coordinates is a little strange; the area inside a circle given (in polar coordinates) by  is NOT just
 . Here is the rule:
Area inside
. Here is the rule:
Area inside
 is given by
 . This comes from the fact that the area in a thin wedge with radius and angle
  is
is
 . Note that this gives you the right answer for a circle:
  . So to find the area of the cardiod use the following command.
>Area1:=1/2*int((1-cos(theta))^2, theta=0..2*Pi);
>evalf(Area1);
- Consider the vector function
 for
for
 .
.
- Calculate the coordinate point on the curve at
 and the slope of the curve at
.
and the slope of the curve at
.
- Define the vector equation of the line through the point above tangent to the curve at that point.
- Plot the graph of and this tangent line on the same graphover the interval
.
Identify the graph as a cardioid, limaçon, or rose.
- Find all points of intersection for each pair of curves in polar
coordinates.
-
 and
and  for
for
 .
.
-
 and
and
 for
.
for
.
- Find the angles that create only one petal of the five petal rose given by the equation
 . Plot only one petal and find the area of that petal.
Next: About this document ...
Up: lab_template
Previous: lab_template
Dina J. Solitro-Rassias
2014-10-06
