


Next: About this document ...
Up: lab_template
Previous: lab_template
Subsections
The purpose of this lab is to acquaint you with some common three-dimensional shapes.
Three-dimensional curves can be entered as an expression.
>with(plots):
>blob:=z=x^2+3.7*y^2;
>implicitplot3d(blob,x=-15..15,y=-10..10,z=0..200,axes=boxed,
numpoints=5000);
The sphere can be entered as one implicit expression.
>g:=x^2+y^2+z^2=1;
>implicitplot3d(g,x=-1..1,y=-1..1,z=-1..1,axes=boxed);
To look at the cross-section of the sphere you cut the sphere along a plane - i.e. you hold a variable constant. So the intersection of the sphere and the  plane is:
>implicitplot(subs(z=0.5,g,x=-1..1,y=-1..1,labels=[x,y]);
Notice that the plot is a two-dimensional circle. To intersect vertical planes hold the  or
or  constant.
>implicitplot({subs(y=0.6,g),subs(y=-0.8,g)},x=-1..1,z=-1..1,labels=[x,z]);
Other three-dimensional shapes can be made from known conic sections. A few of these will be analyzed in the exercises.
(Note: In all plots include the option scaling=constrained).
- Given
- A)
- Plot the three-dimensional shape over the intervals
 ,
,
 , and
, and
 .
.
- B)
- Is the given equation a function?
- C)
- Plot the intersections of this shape and two planes perpendicular to the z-axis. What two-dimensional shapes are graphed?
- D)
- Plot the intersections of this shape and two planes perpendicular to the y-axis. What two-dimensional shapes are graphed?
- E)
- Plot the intersections of this shape and two planes perpendicular to the x-axis. What two-dimensional shapes are graphed?
- F)
- What three-dimensional shape is the equation (a sphere, a paraboloid, an ellipsoid, an hyperboloid, or an hyperbolic paraboloid (saddle))?
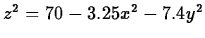
- Given

- A)
- Plot the three-dimensional shape over the intervals
 ,
,
 , and
, and
 .
.
- B)
- Is the given equation a function?
- C)
- Plot the intersections of this shape and two planes perpendicular to the z-axis. What two-dimensional shapes are graphed?
- D)
- Plot the intersections of this shape and two planes perpendicular to the y-axis. What two-dimensional shapes are graphed?
- E)
- Plot the intersections of this shape and two planes perpendicular to the x-axis. What two-dimensional shapes are graphed?
- F)
- What three-dimensional shape is the equation (a sphere, a paraboloid, an ellipsoid, an hyperboloid, or an hyperbolic paraboloid (saddle))?
Next: About this document ...
Up: lab_template
Previous: lab_template
Jane E Bouchard
2014-09-04