next up previous
Next: About this document ...

MA 2611 A' 96 Test 1


1.
(15 points) In order to assess the quality of production, small springs to be used in computer mouse buttons are randomly sampled from the production line once each hour and tested for the amount of force required to compress them. At the end of each day, the company's quality supervisor looks at a histogram of the data, which, she says, is all she needs to tell if the process is operating properly.

a.
Do you agree that a histogram is all she needs to look at? Why or why not?


ANS: No, since a histogram cannot detect non-stationarity.


b.
What alternative display(s) would you suggest she look at? In what way(s) would your suggested display(s) help her better evaluate the production process' performance?


ANS: A time series plot of force versus time. It can tell her when the process begins becoming non-stationary, and therefore help in quickly dientifying problems.


2.
(40 points) Figure 1 is a frequency histogram of the lifetimes, in hours, of 100 water pump impeller blades, produced by a stationary process. For these data, we note that Q1=358.5, Q2=565.5, and Q3=837.5.


Figure 1:   Impeller blade lifetimes for question 2
\begin{figure}
\centerline{
\psfig {file=test1f1.ps,height=4in,width=6in}
}
\vspace{2ex}\end{figure}

a.
On the graph note the approximate location of the mean.


ANS: The mean is at 635. Anything close is ok.


b.
Give the value of one meaningful measure of location and one of spread for these data. Tell what each measures.


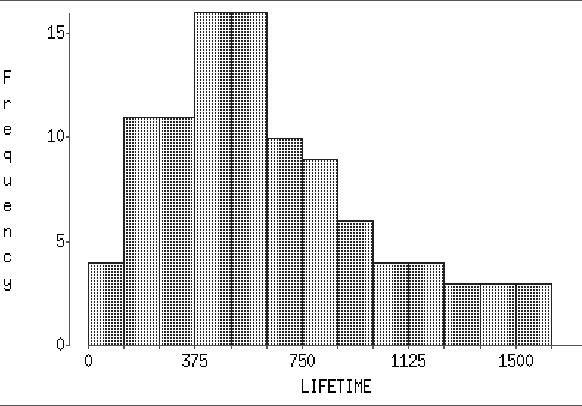
ANS: Location: mode, 500, which is at the center of the highest bars, or the median, 565.5, above which and below which lies half the data. Spread: IQR, 837.5-358.5=479, the spread of the middle half of the data.


c.
Obtain the 5 number summary of the data. If the 10 largest impeller lifetimes are 1605, 1573, 1547, 1474, 1471, 1395, 1352, 1285, 1272, and 1237, and if the smallest observation is 48, construct a box-and-whisker plot of the data. Are any outliers suggested by this plot? If so, what are their values?


ANS: The lower adjacent value is 48, which is the smallest data value greater than $A_{-}=358.5-1.5\times 479=-360$. The upper adjacent value is 1547, which is the largest data value less than $A_{+}=837.5+1.5\times 479=1556$. The rest of the five number summary consists of Q1=358.5, Q2=565.5 and Q3=837.5. The boxplot is in Figure 2.


Figure 2:   Boxplot for problem 2c
\begin{figure}
\centerline{\includegraphics*[height=2.0in,width=6in]{test1f2.ps}}
\vspace{2ex}\end{figure}


d.
A new water pump of the same type has just been put into service. If you had to supply one number as an estimate of the lifetime of its impeller blade, what number would you use? Tell how you obtained this number and why you chose it.


ANS: The mode, 500, which is at the center of the highest bars. These are the bars containing the greatest number of observations.


3.
(45 points) The Boston Globe of September 18, 1996 reports, ``A heart monitoring procedure used a million or more times per year in this country to treat critically ill patients may actually be killing some of them, researchers say.'' The article goes on to describe a study of a 25 year old procedure called right heart catheterization in which a thin tube called a catheter is threaded through a vein in the neck or groin into the pulmonary artery near the right side of the heart to glean information on cardiac function. In the study, researchers considered the cases of 5,735 critically ill patients admitted to intensive care units in five US medical centers. The 38 percent of patients who had right heart catheterization were matched with very similar patients who did not have the procedure. After adjusting for age, sex, severity of illness and other measures, the catheterized group had 24 percent more deaths within 30 days of hospital admission.

a.
Was this study a controlled experiment? Why or why not?


ANS: No. Treatments were not assigned to experimental units.


b.
Identify the response variable.


ANS: Outcome: death or not within 30 days.


c.
Explain why this study does not establish conclusively that right heart catheterization is causing a greater number of deaths in critically ill heart patients than would otherwise occur.


ANS: Because researchers were not allowed to control assignment of treatment to patients, or to control or randomize with respect to nuisance variables, the results can only suggest an association, not establish cause-effect.


d.
You are a consultant called in to design a follow-up study to establish conclusively if right heart catheterization is causing a greater number of deaths in critically ill heart patients than would otherwise occur. What kind of study would you design? Describe how and why you would use blocking, randomization and replication.


ANS: I would design a controlled experiment in which treatments (right heart catheterization or alternative procedures) were assigned to patients by the researchers. Blocking could involve factors such as hospital, surgeon, severity of patient illness, patient age, patient gender, etc., and would be used to reduce variation in the responses due to those factors. Randomization would be used for whatever was not blocked to remove unsuspected sources of bias. For example, within blocks, treatments would be assigned to patients at random.


next up previous
Next: About this document ...
Joseph D Petruccelli
6/16/1998